The 6 essential customer service KPIs are:
1. Customer Satisfaction Score (CSAT)
2. Net Promoter Score (NPS)
3. First Contact Resolution (FCR)
4. Customer Retention Rate
5. Average Handle Time (AHT)
6. Customer Effort Score (CES)
Each metric reveals specific aspects of your support performance. Below you’ll find formulas, benchmarks, and actionable tips for each KPI.
Performance in customer service is measurable – and it should be. Clear KPIs show what works, what needs attention, and how your team contributes to the overall customer experience.
In this guide, you’ll find six essential KPIs, each explained in plain terms – including how to calculate them, what they reveal, and how to act on them.
What defines a high-performing support team
Top-performing support teams:
- Communicate clearly and professionally
- Solve problems independently
- Know their product and processes
- Learn from data
- Adapt across channels and customer types
These traits are easier to develop and improve when backed by the right metrics.
6 Customer service KPIs (with formulas & benchmarks)
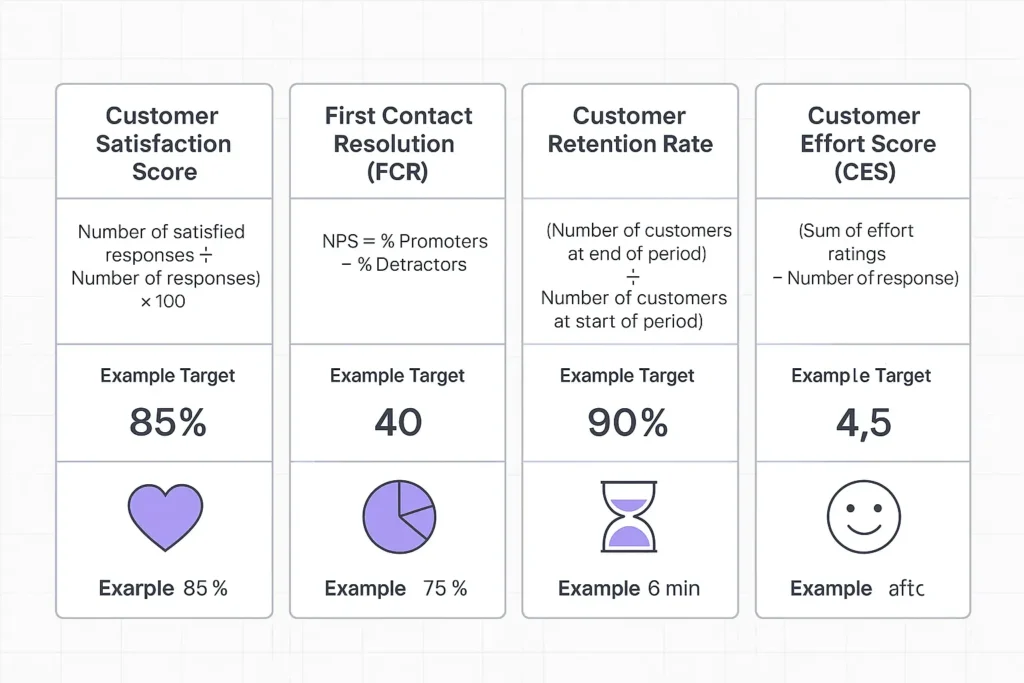
1. Customer Satisfaction Score (CSAT)
CSAT reflects how satisfied customers are after an interaction.
Formula:
(Positive responses ÷ Total responses) × 100
Example:
If 82 out of 100 customers rate your service positively → CSAT = 82%
➡️ For better context in surveys, consider using AI Ticket Summary to summarize each conversation automatically.
2. Net Promoter Score (NPS)
NPS measures long-term sentiment and brand loyalty.
Scale:
- Promoters: 9–10
- Passives: 7–8
- Detractors: 0–6
Formula:
NPS = % Promoters – % Detractors
💡 Background and benchmarks: NPS Methodology
3. First Contact Resolution (FCR)
FCR tells you how many tickets are resolved on the first reply.
Formula:
(Resolved on first contact ÷ Total tickets) × 100
Higher FCR = fewer follow-ups and more efficient support.
🔄 Use Ticket Classification to route incoming requests to the right agents and improve FCR.
4. Customer Retention Rate
Retention rate shows how many customers remain over time – a key indicator of loyalty.
Formula:
(End-period customers ÷ Start-period customers) × 100
Important for understanding service impact beyond individual interactions.
📌 Use in combination with churn analysis and contract renewal data.
5. Average Handle Time (AHT)
AHT measures the average time needed to resolve a ticket, including all communication and wait time.
Formula:
Total handling time ÷ Number of tickets
Keep an eye on AHT trends – not just the value itself. AHT that drops too low may signal rushed support.
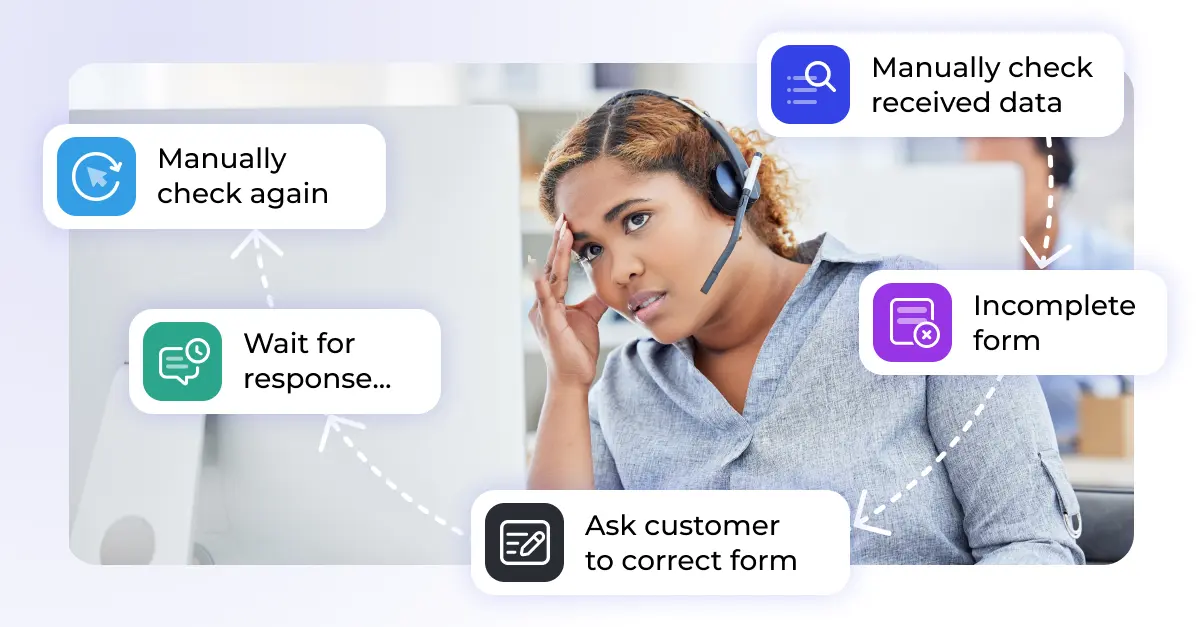
⚙️ Automation helps reduce handling time:
Process CSV and OCR Scanner can eliminate manual steps like copy-pasting form data.
6. Customer Effort Score (CES)
CES reflects how easy it was for a customer to solve their issue.
Typical scale:
Very easy – Easy – Neutral – Difficult – Very difficult
Low-effort interactions tend to build loyalty – even more than delight, according to research.
📖 Source: Harvard Business Review: Stop Trying to Delight Your Customers
Customer Service KPIs by idustry
Benchmark values vary by industry – here are typical ranges for four core customer service KPIs. Use these as orientation, not absolute targets.
| Industry | CSAT (%) | NPS | AHT (min) | FCR (%) |
|---|---|---|---|---|
| SaaS / Software | 92.0 | 40.0 | 5.0 | 70.0+ |
| Retail & E-Commerce | 82.0 | 64.0 | 4.0 | 70.0+ |
| Healthcare | 81.0 | 46.0 | 7.0 | 70.0+ |
| Financial Services | 80.0 | 25.0 | 6.0 | 70.0+ |
Note: Values are industry averages based on multiple benchmark studies. They vary by company size, product complexity, and support model.
Best practices for working with KPIs
Tracking KPIs is only valuable if you do something with the data.
- Start with 3–4 key metrics
- Set realistic targets based on your current baseline
- Watch for patterns over time, not just daily snapshots
- Use results in 1:1s, team coaching, and process reviews
- Automate wherever possible
📊 Knots tools help automate tagging, summaries, and Slack alerts – so performance data becomes part of your workflow.
Tool support for KPI measurement
If you’re using Zendesk, you already have built-in tools like Explore – but that’s just the start.
✅ Use Knots apps to:
- Set custom triggers for SLA breaches
- Send alerts to team leads via Slack
- Clean up old tickets with Redact Tickets
- Remove files you no longer need with Remove Attachments
Looking to connect data to your CRM, ERP or reporting layer? Sync integrations make it easier.
Conclusion
Measuring customer service performance doesn’t require dozens of metrics – just the right ones.
Track them consistently. Act on trends. Involve your team.
🧩 Need help cleaning up ticket data, tracking KPIs, or automating reporting flows?
Get a free Zendesk audit from Knots – or explore our AI-powered support tools.